Distributed Tracing Overview
When an organization has applications that consists of tens, hundreds, or thousands of services running across many hosts, and sharing messages over one or more event meshes, it's no longer possible to diagnose problems simply by troubleshooting an error message or looking at a log. In this kind of system, you need a solution that can track an event all the way from the sending application, between event brokers, and to the receiving application. Distributed tracing provides this ability, allowing an administrator to trace the lifecycle of an event as it travels through the event mesh.
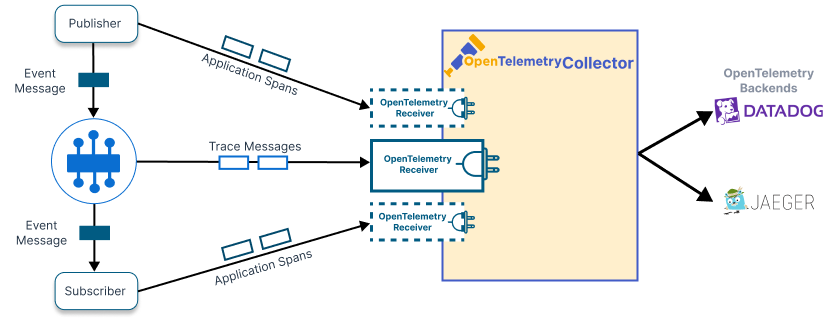
When distributed tracing is enabled, the event broker generates special guaranteed messages when certain operations happen. The publisher and subscriber APIs also generate spans when messages are sent and received. OpenTelemetry receivers then consume these messages from a particular queue and convert them to a format that can be received, processed, and viewed using common Open Telemetry backends such as Jaeger and DataDog.
The distributed tracing functionality of SAP event broker services complies with the OpenTelemetry specification.
Which Event Broker Actions are Traced?
Spans are generated at the following points:
- event message sent by the event broker to the consumer (Send Span)
- event message acknowledged by the consumer (Send Span)
- event message received by the event broker (Receive Span)
- event message enqueued by the event broker (Receive Span)
Tracing in the Event Broker
The event broker generates spans at certain points in the lifecycle of an event message. A span represents a single operation on the event broker, such as receiving and sending an event message.
The event broker generates a span when it receives an incoming event message or sends an outgoing event message. The broker sends trace messages, which contain one or more spans, to the telemetry queue. A client binds to the queue and consumes the trace messages. This client then converts the internal format into the appropriate format to send to the backend (Jaeger, Splunk, Prometheus, Zipkin, DataDog, DynaTrace, and so on).
For information about how spans are correlated to produce traces, see Context Propagation for Distributed Tracing.
For details about how to set up event broker services for distributed tracing, see Enabling Distributed Tracing.
For more information, see Context Propagation with Solace Messaging APIs