Context Propagation for Distributed Tracing
As discussed in the overview, distributed tracing tracks an event all the way from the publishing application, between event brokers, and to the receiving application. A distributed trace, or simply a trace, is a record of the path taken by an event message as it propagates through an event mesh. A trace is made up of the spans that are emitted at each point along the journey. An OpenTelemetry backend, such as Jaeger or DataDog, assembles these spans into a trace and provides a visual view of the entire lifespan of an event message.
Trace context is the metadata that allows new spans to be created as children of another span in the same trace, or to link to other spans in the trace, regardless of where the other spans are generated. Context propagation is the mechanism by which that metadata is carried by event messages across service and process boundaries.
Context Propagation in the Event Broker
Two types of context can be propagated in event messages:
- Span context—Solace APIs and event brokers can interpret and modify trace context within a message as the message is transported.
- Baggage (also known as correlation context)—Baggage is a set of key-value pairs that can be injected into and read from the context. Solace APIs and event brokers never modify baggage; they only read it and include it in trace messages.
Trace context and baggage are carried in the event message. If an event message is successfully traced (that is, it generates and enqueues a span), the event broker updates the event message's trace context with the context from the span. If, at any point after receiving an event message but before generating a span, the event broker encounters a condition where it cannot trace the event message (for example, the telemetry queue is full), the broker passes the trace context unchanged in the event message to the next hop in the event mesh.
To handle event messages and generate spans appropriately, the event broker does the following when it receives an event message:
- Performs basic checks (such as verifying that the message's receive flow is valid, the message is the next expected message on that flow, the message complies with any topic access controls). If any of these tests fail, the message is discarded without tracing.
- Determines whether the event message is to be traced. If the message is to be traced, it sets the
sampledflag in the message's trace context. Otherwise, it leaves thesampledflag unchanged. - Processes the event message.
- Uses the event message's trace context to create a child span.
- Updates the event message's trace context at the same time the event message and trace message are persisted. The event message's trace context isn't updated sooner so that, if the event broker encounters a condition where it cannot trace the event message (for example, the telemetry queue is full), it doesn't generate a trace message—it passes the received trace context unchanged in the event message to the next hop in the event mesh.
Context Propagation with Solace Messaging APIs
Context propagation with
You deploy the
The Solace OpenTelemetry API Libraries support W3C propagators only.
Visualizing Trace Information in the Backend
Tracing helps you understand the path an event message takes as it travels through distributed systems. A trace is made of one or more spans, with the first span representing the root span. Every root span represents a request from start to finish. As a request moves through a distributed system, it usually generates multiple spans. If a new span is generated by a request it is considered a child span, and the span that generated it is its parent. Child spans provide additional context of the steps that occur during a request.
OpenTelemetry receivers collect different types of spans, including spans from the OpenTelemetry APIs and the event broker. The OpenTelemetry Collector collects, processes and exports these spans to a backend, where they are assembled into waterfall visualizations of end-to-end traces. These visualizations show the relationship between a root span and its child spans, and can help you improve and debug your distributed applications. The diagram below shows how spans generated at different points in a distributed system are assembled into an end-to-end trace in an OpenTelemetry backend:
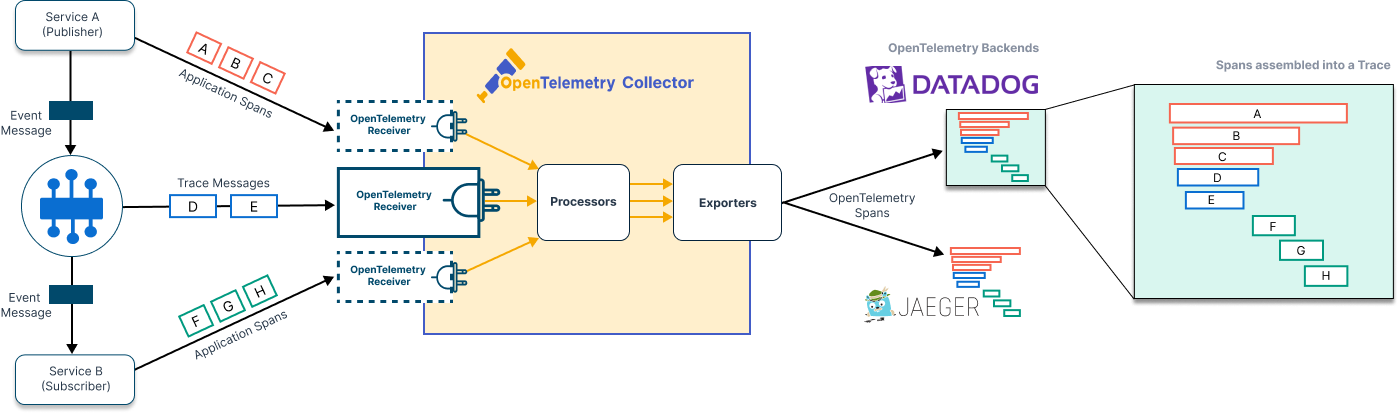
For a detailed explanation of how spans are collected into a trace, see OpenTelemetry Traces.