Follow this tutorial to learn how to log in and navigate advanced event mesh.
At the end of this tutorial, you can decide on the next tutorials to try based what you want to learn next:
Before You Begin
Before you begin, you require a user account to log in to the Cloud Console. To get a user account, you must be invited by your advanced event mesh administrator. Contact your advanced event mesh administrator or contact SAP.
To use advanced event mesh, you require a supported web browser. For more information, see Supported Web Browsers.
Log in to the Cloud Console
To start using advanced event mesh, log in to the Cloud Console. From there, you can take a look around to familiarize yourself with the interface:
- Log in to the Cloud Console if you have not done so yet. The URL to access the Cloud Console differs based on your authentication scheme. For more information, see
- Enter the email address and password that you used when you signed up and then click Sign in.
- Take a tour of the Cloud Console if it's your first time logging in; otherwise, jump in and start some other tutorials.
Tour of the Cloud Console
Start your journey learning about advanced event mesh,by taking a tour of the Cloud Console.

The first page is the Welcome page that shows the tools that you can use, based on the roles that you're assigned. On the left, is a navigation bar that you can use to jump from tool to tool as required. On the bottom of the navigation bar, these actions are available:
- Learn & Help

- Links to the advanced event mesh documentation, feature introductions, SAP Developer Community, Support page, and a chat to contact us.
- Notifications

- System information about your account. For more information, see System Notifications.
- User & Account

- Your profile information, account details, API token management, notification settings, and a menu to switch accounts if your user profile is part of more than one advanced event mesh account. For more information, see Managing Accounts and Users.
Advanced Event Mesh Tools
The Cloud Console gives you access to tools for event streaming, event management, and event insights.
To access these tools, you can select the tool from the navigation bar or click a card on the Welcome page.
Mission Control
To manage event streaming, you use Mission Control. Mission Control provides the following tools:
- Cluster Manager
- You use this tool create, configure, and manage event broker services. For more information, see Cluster Manager.
- Mesh Manager
- You use this tool to visualize and connect your event broker services. For more information, see Mesh Manager (Beta).
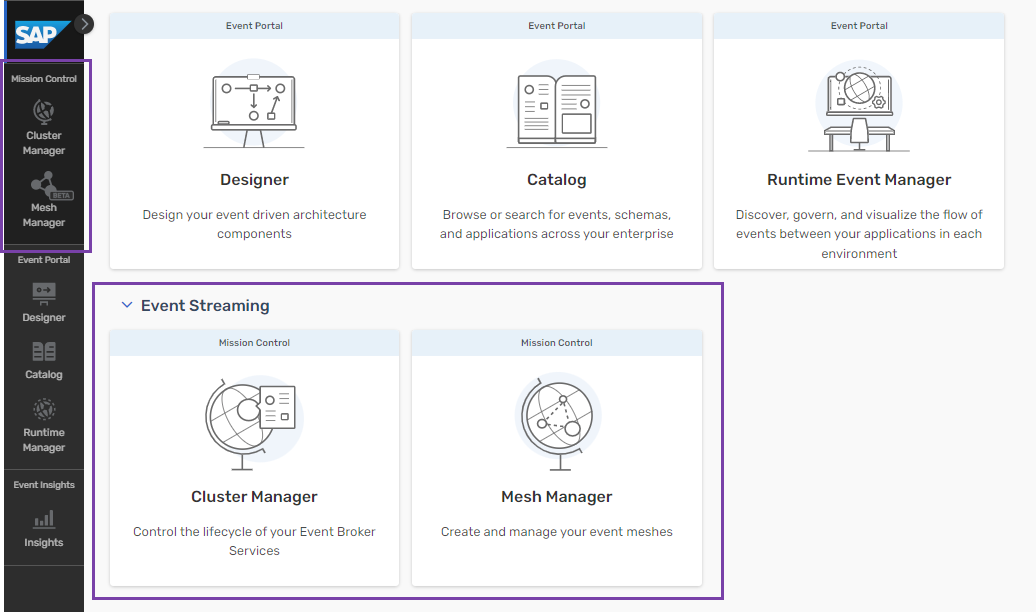
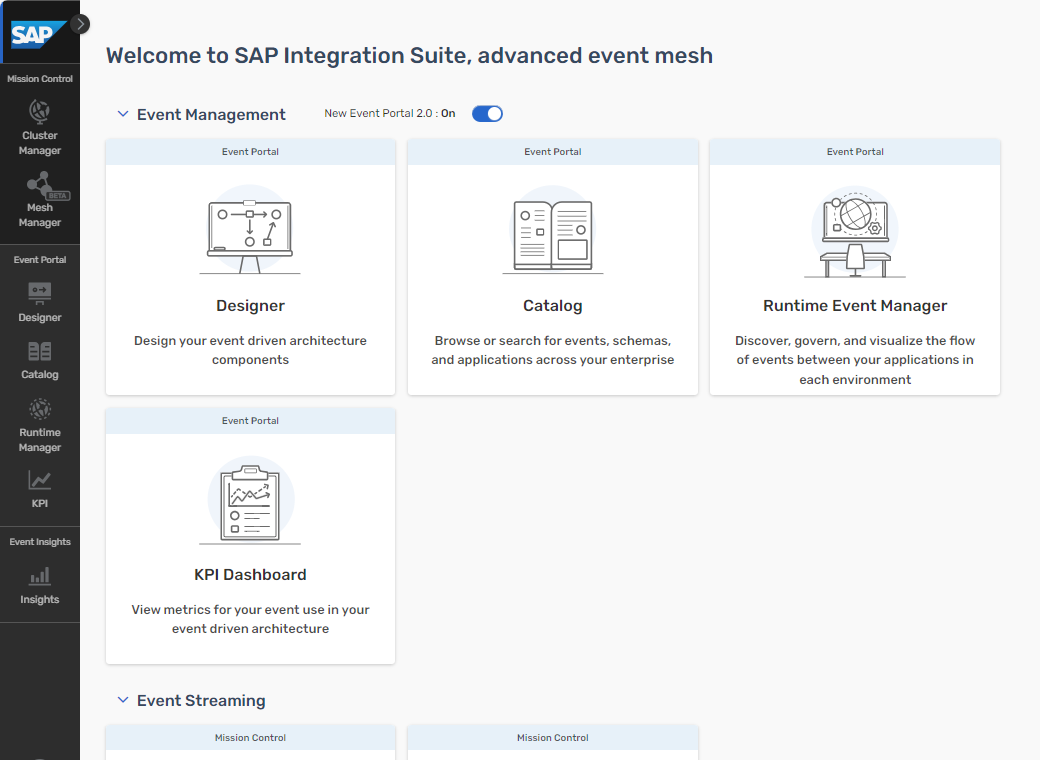
Event Portal
To design, discover, visualize, and share the various aspects of your event-driven architecture (EDA), you use Event Portal. Event Portal provides the following tools:
- Designer
- You use this tool to design and view all aspects of your EDA. For more information, see Designer.
- Catalog
- You use this tool to browse events, schemas, and applications. it has an interface that permits you to search, sort, and filter events in your EDA. For more information, see Catalog.
- Runtime Event Manager
- You can discover and visualize events in your EDA. This includes the discovery and import of events, schemas, and application interactions. For more information, see Runtime Event Manager.
Event Insights
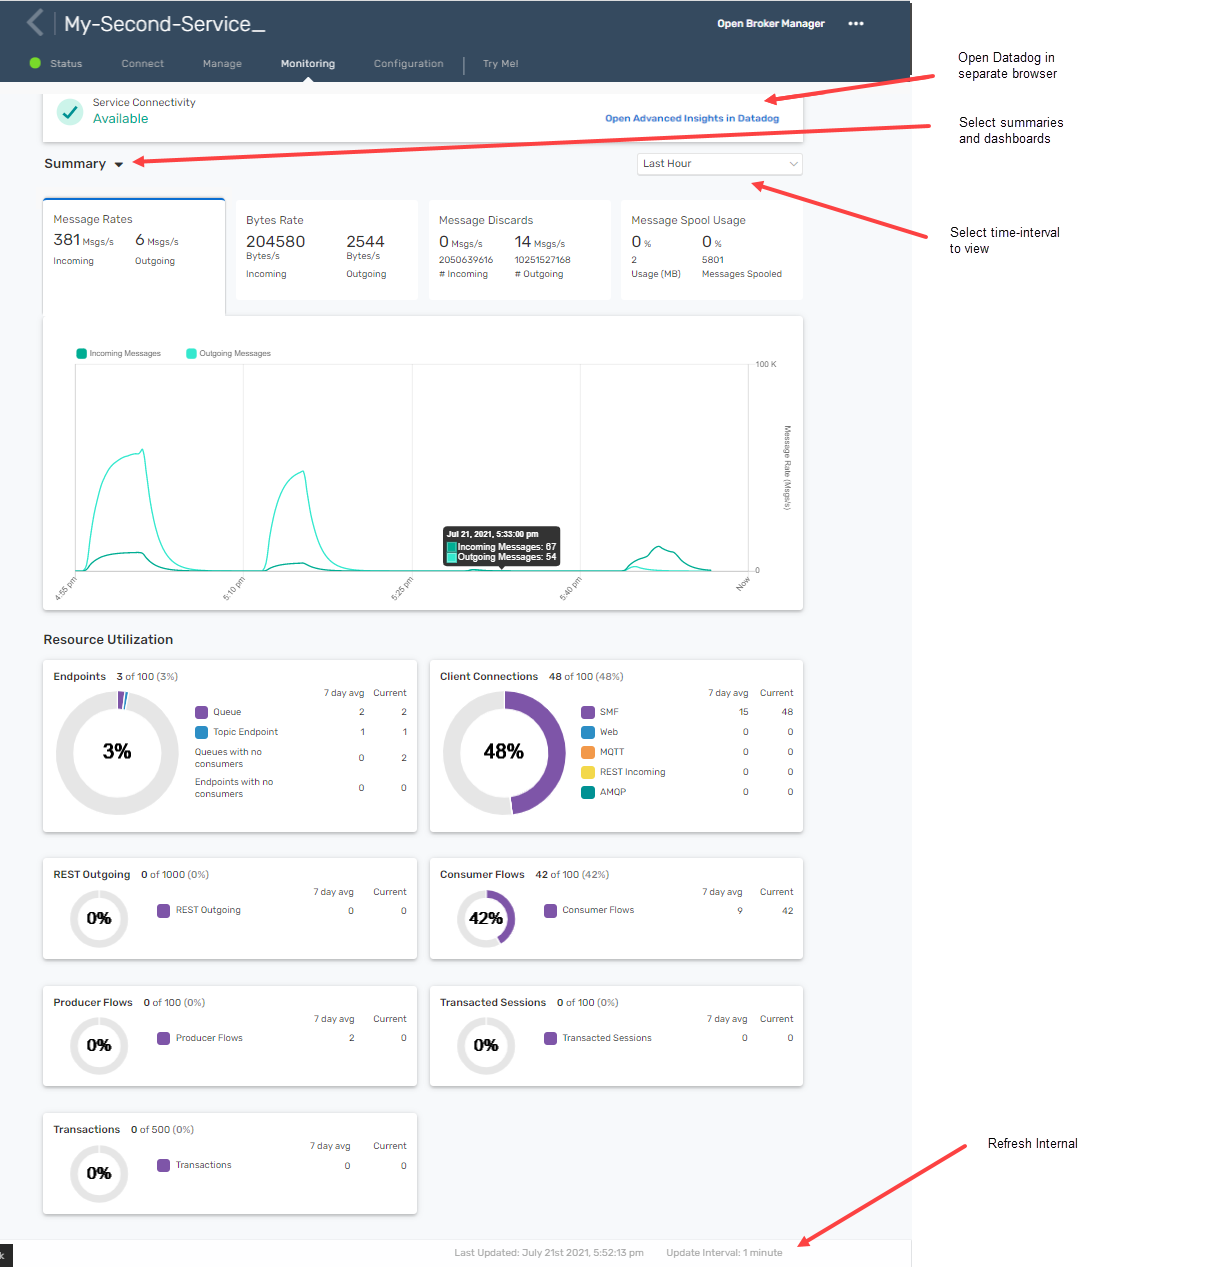
You use Insights to monitor your event broker services and receive alerts, making it easier for teams to ensure their event broker services and applications are performing as they should. For more information, see Insights.
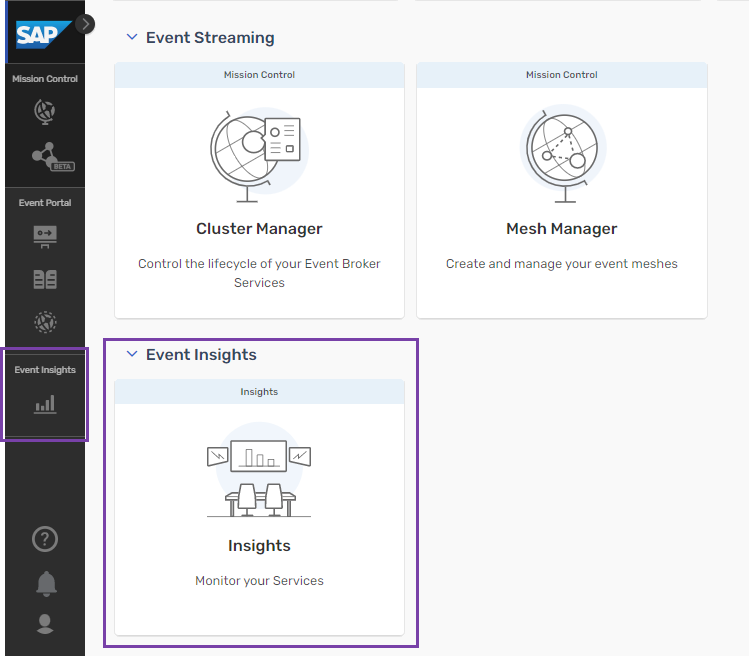
To monitor and get an insights to your EDA, you can access dashboard visualizations of historical data and notifications regarding your event broker service using Insights. Insights is accessible from a tab for each service. The image below shows where to access Insights visualizations:
Next Steps
Now that you're logged in, you can try the following tutorials:
- If you want to learn how to use event streaming with advanced event mesh, you can start by creating an event broker service. For more information, see Creating Your First Event Broker Service.
- If you want too learn how to design your EDA with advanced event mesh, you can start by learning how to use Designer. For more information, see Designing Your Event-Driven Architecture.
- To get an overview of monitoring and using Insights, see Insights.