SAP provides Insights dashboards for Datadog, Insights monitors for Datadog, and metrics that are valuable for general use cases whether you're in an operations and integration, or applications support team. The Insights dashboards are based on core best practices from subject-matter-experts and feedback from the SAP community. You may want to extend the Insights Advanced Monitoring capabilities to adapt them to match your specific use cases or requirements.
If you have the Insights Advanced Manager or Insights Advanced Editor role, you can do one or more of following to accomplish this:
- Create your own Insights dashboards for Datadog and then copy widgets from an existing dashboard to add to yours. For more information, see the New Dashboard in the Datadog documentation.
- Clone any of the Insights dashboards to use as a starting point and then add and remove widgets to suite your monitoring requirements. For more information, see Cloning Existing Insights Dashboards for Datadog for Reuse
- On a cloned board or one that you create, you can create custom views, add custom or existing Insights monitors, add custom widgets, customize existing widgets, and create filters. For more information, see the following sections:
For example, you could clone all of the Insights dashboards and then add filters to the widgets on the dashboard to reflect the needs of your team. To make it easier to access, you could also ask users to add them as favorites in their Datadog account.
- Create custom monitors and clone existing monitors to customize them. For more information, see Creating Custom Monitors
- Mute monitors whose default thresholds don't meet your needs, or to limit the amount of notifications you receive from specific monitor types, see Muting Insights Monitors for Datadog.
- Schedule downtime for monitors. This allows you to turn of notification from specific, or all monitors for a time a specified time, once or on a recurring schedule. This is useful feature to manage notification during maintenance, or upgrades. See Scheduling Downtime.
Cloning Existing Insights Dashboards for Datadog for Reuse
It is possible that your business has its own unique requirements, but you may find that a small modification to one of the Insights dashboards for Datadog may help optimize its use. The Insights dashboards provided by SAP cannot be modified. For your organization, if you need to modify a dashboard, we recommend that you clone one of the Insights dashboards and adapt it as required.
Do not put any cloned dashboards that you create into any lists that have Solace or Insights in the name. This could cause changes to occur to your dashboard during upgrades or content changes that are done by SAP.
Before you cloning Insights dashboards, it's a good idea to become familiar with how to create and modify dashboards in Datadog. In addition to cloning, you can also create your dashboards and then add metrics and monitors to your dashboard. In either case, here are some suggested topics to help you get started with dashboards in the Datadog documentation:
After you've cloned a dashboard, you might want to do further customizations that include:
Creating Custom Monitors
SAP provides predefined Insights monitors for Datadog that you can use on your dashboards; however, you may want to create a custom monitor of your own or clone and customize an existing monitor. If you want to create your own monitor, you can base it off any metric or log that is parsed already as a monitor in your account; cloning an existing monitor simply accelerates the process of creating your own custom monitor. An example of cloning and customizing a monitor can be found in Cloning and Customizing the Template Monitor below.
There are different types of monitors available that include status-based, log-based, and metric-based monitors. SAP also provides a sample template monitor which is not picked up (or used) by the Insights dashboards for Datadog, which you can use to create custom monitors. The template monitor has the solace_customizable_template tag to distinguish it from the other monitors provided with insights that are active. Custom monitors that you create are picked up in the Insights dashboards provided with Insights when they have the custom_insights tag. This aspect is particularly useful when you use the Insights dashboards to monitor your estate and you want custom monitors to appear on any Insights dashboards.
To understand how to clone a monitor, see cloning monitors, see Manage Monitors in the Datadog documentation, but ensure that you follow the guidelines listed below in this section. Not adhering to the guidelines that we describe in this section can impair SAP's ability to properly manage your event broker services and cause inconsistencies in the monitoring data reported in the dashboards.
The provided template monitor contains a brief outline explaining how to clone and configuring your own monitor. To understand how to clone and configure a monitor, see Manage Monitors in the Datadog documentation. While you can also clone and configure based on other monitors, you must ensure that you follow the guidelines listed below in this section. Not adhering to the guidelines can impair SAP's ability to properly manage your event broker services and cause inconsistencies in the monitoring data reported in the dashboards.
- You can clone any monitors that have been tagged with
solace_insights, however, if a monitor has the tagsolace_rmms, DO NOT clone it.There are risks and consequences to cloning the monitors that are tagged with
solace_rmms. Incorrectly cloning these monitors in your account can impair SAP's ability to properly manage your event broker services, which may result in degradation of service. If you clone any monitors that clearly indicate not to copy, it can result in you temporarily losing access to your Datadog account and all changes in your Datadog account being reset. - After you have cloned a monitor, remove the SAP-specific tags (
solace-*), such assolace-insightsandsolace_customizable _template, so that it prevents your cloned monitor from being modified or removed during upgrades or content refreshes.- The sample template monitor is meant for you to clone as a template and is not actively used (or picked up in the Insights dashboards). Only sample template monitors have the
solace_customizable_templatetag. If you clone a template monitor, ensure that you remove thesolace_customizable_templatefrom the cloned monitor.
- The sample template monitor is meant for you to clone as a template and is not actively used (or picked up in the Insights dashboards). Only sample template monitors have the
- If you want a custom monitor to be picked up in by the Insights dashboards, you must add the
custom_insightstag to the monitor. - Using the provided sample template monitor is recommended, but if you clone an active monitor, there are a few caveats to consider:
- you get the notifications from the original SAP-provided monitor as well as the notification from the cloned monitor that you created
- if you add
custom_insightsto a cloned monitor, it can result in both monitors appearing in the Insights dashboards
For information about cloning monitors, see Manage Monitors in the Datadog documentation.
Cloning and Customizing the Template Monitor
SAP provides a sample template monitor that you can clone and customize to create your own custom monitors that log metrics that are of importance to your organization. With the custom template monitor you can define the event logs to monitor, the alert conditions, who is notified when those conditions are met, and what message they receive.
The template monitor is provided as is to enable you to create your own monitors. SAP does not offer or provide support for monitors created using the custom template monitor.
In the procedure below, we create a new monitor that notifies us when a client is having connectivity issues.
- In Datadog, on the Monitors page select the Manage Monitors tab, and enter
solace_customizable_templatein the search field to find the customizable template monitor.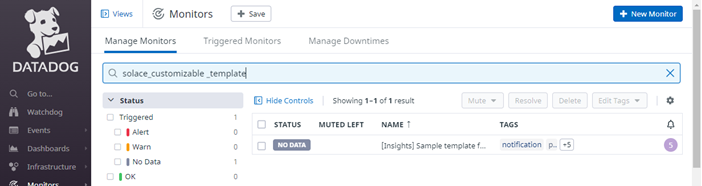
- Select the Sample template for broker event log monitors by clicking on its name in the Name column.
- To clone the template monitor click the
 icon in the top right corner and select Clone.
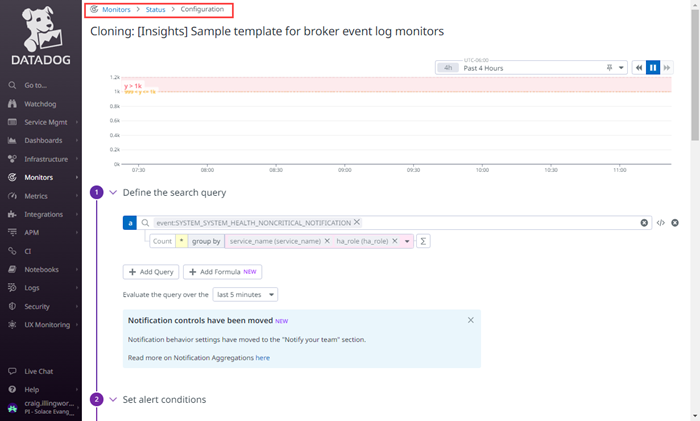
The cloned template monitor opens in edit mode (indicated by the breadcrumb ending with configuration in the top left corner). You can now define your monitors new parameters.
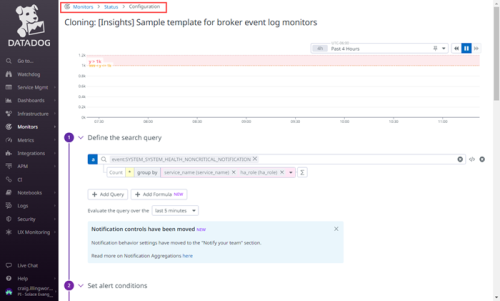
- In section 1, click in the field at the top to define your search query. For example, enter
event:SYSTEM_CLIENT_CONNECT_FAILas your search query. - For a complete list of event logs you can use, see the Event log descriptions .
- For information about syntax, see the Log Search Syntax section in the Datadog documentation.
- Next you can define the criteria that triggers the monitor. For example, you can define the Count. To do this, click on the field to the right of the group by and select
service_name(service_name)andclient_username(@client_username)from the drop-down list. Whenever this unique combination appears in our selected logs, a notification is triggered.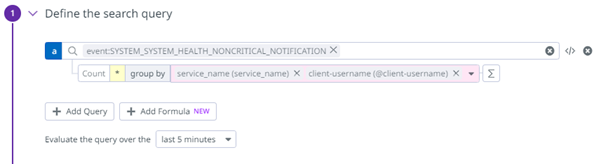
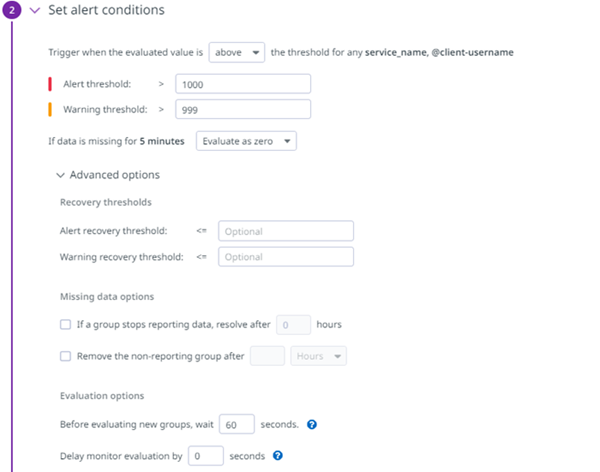
- In section 2, you set the conditions that cause an alert to trigger: You can use the fields in this section to set the thresholds that trigger alerts and warnings. Note that the default values for both the Alert and Warning thresholds are set to unrealistically high values to prevent the monitor from triggering. This prevents Datadog from sending you unnecessary alerts. You should define different thresholds for each which are meaningful for your organization. When defining your thresholds, SAP recommends using 1 as a starting point.
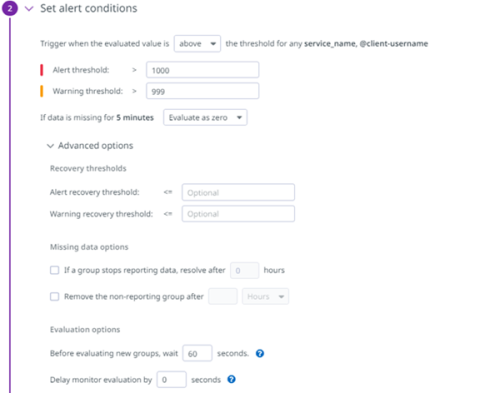
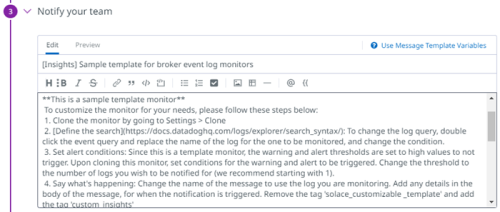
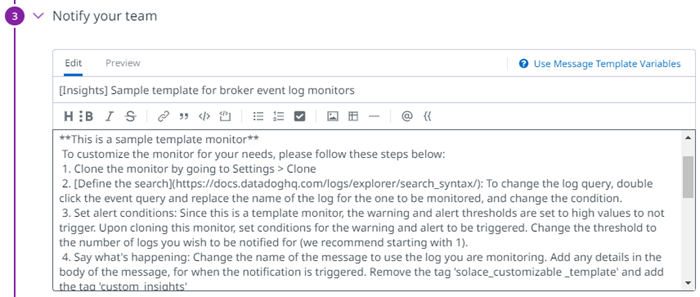
- In section 3, customize the email that is sent and define tags for the monitor. For the email, you must enter a title. You can also customize the contents of the email, and you can use markdown formatting and variables as required. For more information, see Notifications in the Datadog documentation for more information.
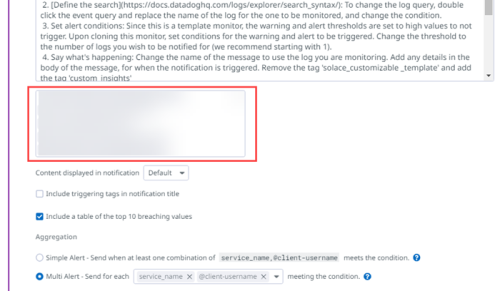
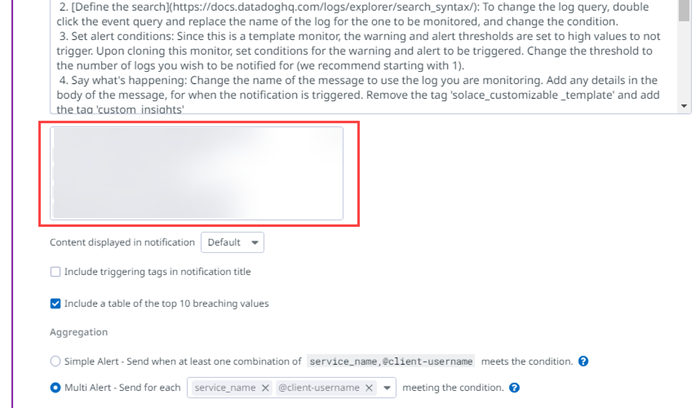
- Continuing in section 3, use the field directly below the notification field to enter the email addresses of the people who need to be notified when alert or warning levels are reached. You can use the remaining fields to define when they are notified.
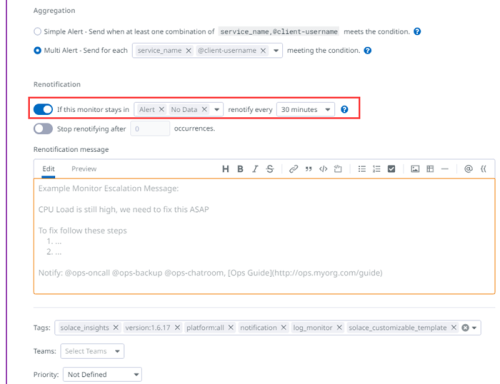
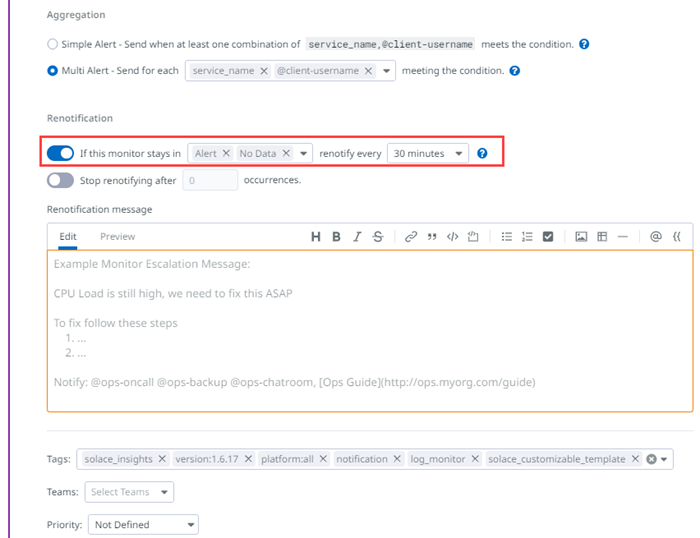
- Optional: Continuing in section 3, you can enable the Renotification toggle to define a second message that is sent if the warning or alarm thresholds persist.
- Continuing in section 3, you must modify the Tags field located below the Renotification message field toggle. It is critical that you remove the following tags:
solace_insightssolace_customizable_templatesversion:*.*.*
You must then add the
custom_insightstag. This prevents your custom monitor from being affected by future updates.
You have successfully configured a monitor that alerts you whenever a client has issues connecting to your services.
Muting Insights Monitors for Datadog
You can mute Insights monitors for Datadog. When a Insights monitors is muted, it continues to trigger on alerts and warnings, but it won't send out notifications. There are numerous reasons you may want to mute Insights monitors. Perhaps you want to be notified at different thresholds than those set by default. You clone one of the Insights monitors, set the thresholds you need, and then mute the original, ensuring you only receive notifications from your customized monitor.
Muting Insights dashboards does not affect SAP's ability to monitor the operation of your services. However, a muted Insights dashboards should be configured with caution to avoid missing notifications that are relevant to your monitoring needs. You should note that SAP provides some proprietary monitors that may not be mutable directly without having the correct roles and permissions. You can mute these monitors by scheduling downtime using their monitor tags. See Muting Locked Insights Monitors for Datadog Using Downtime for more details.
- In Datadog, go to Monitors > Manage Monitors to access the list of monitors. You may have to toggle the False setting flag under the Active filter to the left of the table to see a full list of available downtimes.
- Select the monitor you want to mute by clicking it in the list.
- Click on the gear icon in the top right corner and select Clone from the menu that opens.
- Scroll down to section 2- Set Alert Conditions and alter the conditions so that the monitor only triggers notifications according to your requirements. At least one condition must be configured differently than those existing in the original monitor or you won't be allowed to save the cloned monitor.
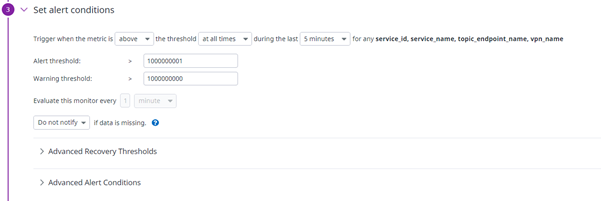
- Once the thresholds are configured, click Save at the bottom of the screen.
- The cloned monitor closes and you are returned to the original monitor. A
 icon becomes available next to the icon in the top right corner. Click to open the mute options.
Note that some monitors can't be muted this way, see Muting Locked Insights Monitors for Datadog Using Downtime for more details.
icon becomes available next to the icon in the top right corner. Click to open the mute options.
Note that some monitors can't be muted this way, see Muting Locked Insights Monitors for Datadog Using Downtime for more details.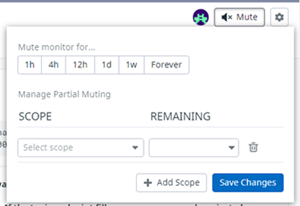
- Set your mute options. In most cases, you can set the mute to forever. This ensures you don't receive duplicate notifications from both monitors, and are only notified according to the thresholds you have configured for the monitor.
The monitor is cloned and opens in configuration mode, which should be familiar from Cloning Existing Insights Dashboards for Datadog for Reuse if you have previously cloned monitors.
Quickly Mute and Unmute Monitors
You can quickly mute and unmute Insights monitors for Datadog directly from the list of Monitors using the quick mute icon  .
.

Muting a monitor this way does so for an indefinite time period. You should note that muting monitors this way generally won't work for proprietary [Insights] monitors, see Muting Locked Insights Monitors for Datadog Using Downtime for details.
Muting Locked Insights Monitors for Datadog Using Downtime
You may encounter some Insights monitors for Datadog that appear to be locked to even users with the Insights Advanced Manager or Insights Advanced Editor role. These locked Insights monitors are generally proprietary monitors provided by SAP. You can see if a monitor is locked by selecting it from the monitor list and scrolling to the Define permissions and audit notifications section of the monitor. A locked monitor displays a statement similar to 'This monitor is locked: only its create and admins can edit it.'
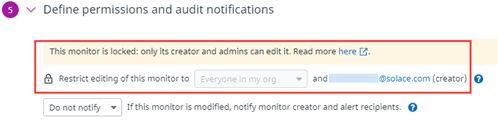
If the monitor is locked, it can still be muted by scheduling a downtime using its tags, see Scheduling Downtime.
Scheduling Downtime
Downtime for Insights monitors can be scheduled in Datadog. A scheduled downtime allows monitors to be muted for a scheduled start time and duration. This is useful if you are planning upgrades or other work that may trigger notifications from the various Datadog monitors. Perhaps you have a datacenter that has a maintenance scheduled on a specific weekday every week, causing notifications to be sent whenever the maintenance is occurring, you can schedule a downtime for that period, muting notification for that time. Once scheduled downtimes have been created, you can later edit, clone, or cancel them, see Edit, Clone, or Cancel a Scheduled Downtime.
Scheduling downtime does not affect the ability of SAP to monitor your services.
- In Datadog, go to Monitors > Manage Downtimes to access the list of currently scheduled downtimes.
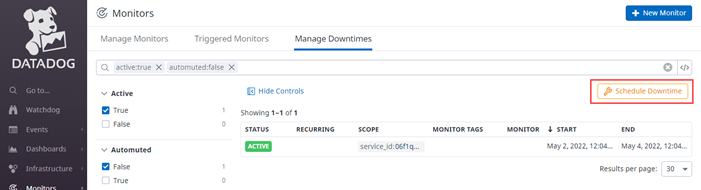
- Click
 to open the Schedule Downtime window.
 - In step 1, choose the monitor to silence. You can select to schedule downtime for monitors by their Monitor Name or Monitor Tags using the
 toggle in the top of the section:
- Selecting By Monitor Name displays the Monitor field where monitors can be selected from a list, or entered if the monitor name is known.
- Selecting By Monitor Tags displays the Monitor Tag field where tags can be selected from a list, or entered if the tag name is known. Tags are attached to monitors and can be viewed by selecting a monitor and viewing its TAGS section.
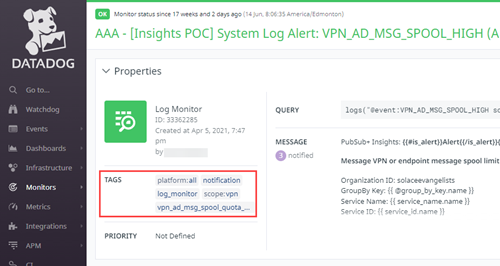
- You can also mute by scope such as
service_id:some_idorqueue_name:some_queue_nameusing the Group Scope fields. - Select Preview Affected Monitors to see a preview of the monitors that are affected by your selections
- In step 2, configure the schedule for the downtime. Downtimes can be one time events, or reoccurring. You can also specify the day, start time, and end time for the downtime.
- In step 3, define a message that is sent to notify people about the scheduled downtime when it occurs. You can enter emails of the people to notify using @handle notation or select them from the menu in step 4.
Edit, Clone, or Cancel a Scheduled Downtime
Once you have created scheduled downtimes, you can edit, clone, or cancel them as required.
- In Datadog, go to Monitors > Manage Downtimes to access the list of currently scheduled downtimes.
- Hover the cursor over the schedule you want to change. A menu appears from the right side of the monitor.
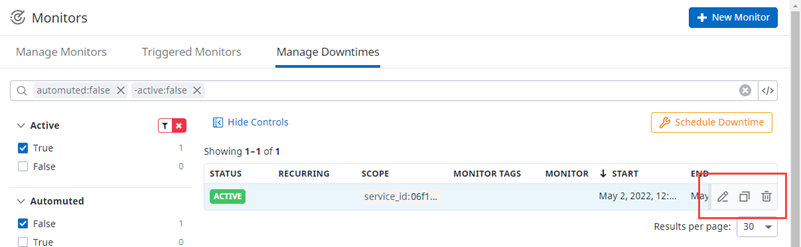
- Click the icon related to the task you want to do:
 - Edit - Opens the Edit Downtime screen. This screen is identical to the Schedule Downtime screen detailed above (Scheduling Downtime) but with the fields already populated. You can change the fields as needed then click Save. You are returned to the list of scheduled downtimes with your edited downtime open.
  - Clone - Opens the Clown Downtime screen. This screen is identical to the Schedule Downtime screen detailed above (Scheduling Downtime) but with the fields already populated. You can change the fields as needed and click Clone. You are returned to the list of scheduled downtimes with your cloned downtime open.
 - Cancel - Opens a confirmation window. Click Confirm to remove the scheduled downtime from the list.
Creating Custom Views
The default view for a dashboard shows everything in a predefined time interval without an filters applied. You may want to create different views to give you different contexts for the information on your dashboard, which can be useful for troubleshooting or analyzing your estate.
When you apply data or time filters to a view, that filtering isn't saved. If you want to save the view based on your filtering choices, click the Saved Views drop-down list and enter a new name for your view. You'll notice an URL is created. That URL can be used to return to the view with your filters applied. The saved view is also now accessible from the Saved Views drop-down list.
For more information about managing custom views, see Saved Views in the Datadog documentation.
Creating Filters
In addition to the some of predefined filters that are provided on the Insights dashboards for Datadog, you can also create your own filters. To do this, you create a Template Variable to create additional filters. These template variables can give you different views the data to help you better understand different aspects of your estate. Here's a quick overview of how to do this:
- On the dashboard, click the Edit beside the
$service_name. - Click Add Variable.
- In the Name field, enter a name for your variable.
- In the next Tag or Attribute field for you new variable, select the tag or attribute to use as a filter.
- (Optional) Select a value for the Default Value field. The default is to use
*(all). - Click Done or repeat steps 2 to 5 until you have created all your variables.
For more information, see the Template Variables in the Datadog documentation.